Builder marketing ROI: model home traffic
Builder marketing ROI: model home traffic
Builder marketing ROI starts with a question most builders answer incorrectly: where are your model home visitors actually coming from? I pulled registration source data across four metro Atlanta communities last quarter. The builder in each case was spending between $8,000 and $14,000 per month on marketing. In three of those four communities, the single highest-traffic source was MLS syndication to Zillow, Realtor.com, and Homes.com, which costs the builder nothing beyond the listing agent’s time. The paid channels (Google Ads, social media, print, signage) produced between 28% and 41% of total registrations.
That gap between spend and source is where most builder marketing budgets leak. This article breaks down the major marketing channels that drive model home traffic, the cost-per-registration benchmarks for each, and how to measure which channels are producing contracts (not just clicks).
For builders running onsite sales management for builders through a professional partner, this analysis is part of the monthly reporting package. For builders managing their own marketing, this is the framework for evaluating where your dollars are working and where they’re not.
The marketing channels that produce model home traffic
Builder marketing operates across seven primary channels. Each has a different cost structure, a different lead quality profile, and a different timeline from first touch to contract. Understanding those differences is the foundation of builder marketing ROI.
MLS syndication and online listing portals
MLS syndication is the baseline. When a new construction community lists inventory on GAMLS or FMLS, those listings syndicate automatically to Zillow, Realtor.com, Redfin, and dozens of smaller portals. The cost is negligible (MLS dues and the listing agent’s time to enter and maintain the data). The traffic is significant.
Across the communities I manage, MLS syndication accounts for 35% to 48% of total model home registrations. These visitors arrive with high intent because they were searching for homes in the area, found a listing, and drove to the community. Registration-to-contract conversion rates from MLS-sourced traffic typically run 12% to 16%, which is the highest of any channel.
The catch is that MLS syndication only works when you have inventory to list. During pre-sales or between spec starts, this channel goes quiet. And the quality of the listing matters enormously. Communities with professional photography, accurate pricing, and complete spec descriptions generate 2.5x more portal inquiries than communities with builder-standard photos and incomplete data.
Google Ads (search and display)
Google Ads is the channel builders most frequently overspend on without understanding the return. Search ads (the text ads that appear when someone searches “new homes in Canton GA”) produce high-intent traffic at a cost of $35 to $75 per registration in the metro Atlanta market. Display ads (the banner ads that follow people around the internet) run $15 to $30 per registration but produce lower-intent visitors who are earlier in the search process.
I track cost-per-registration by channel for every community I manage. The number that matters is cost per qualified registration, meaning a visitor who has the budget, timeline, and motivation to purchase within six months. When you filter for qualification, Google search ads typically produce qualified registrations at $85 to $140 each, and display ads jump to $180 to $260 each.
The mistake I see most builders make with Google Ads is optimizing for clicks or impressions rather than for registrations. A campaign generating 500 clicks per month at $4 per click ($2,000/month) sounds efficient. But if only 22 of those clicks produce a model home visit and only 14 of those visitors register, the cost per registration is $143. If two of those 14 registrations convert to contracts, the cost per contract is $1,000. That’s a reasonable number for a $500,000 home. It’s a terrible number for a $280,000 townhome.
Social media (organic and paid)
Social media divides into two distinct functions for builders: brand awareness (organic posts, community updates, construction progress photos) and lead generation (paid campaigns with registration forms or landing page clicks).
Organic social content builds familiarity but rarely produces direct model home traffic in measurable quantities. I track it anyway because organic social creates the recognition layer that makes paid channels work better. A buyer who has seen your community’s Instagram posts for three months and then clicks a Google ad is more likely to visit and register than a buyer who sees the Google ad cold.
Paid social campaigns on Facebook and Instagram produce model home registrations at $25 to $55 each in the Atlanta market. The lead quality varies. Social leads tend to be earlier in the buying process than search leads. Their registration-to-contract conversion rate runs 6% to 9%, roughly half of MLS-sourced traffic. But the volume can be high, which matters for communities that need to build pipeline quickly during a community launch.
Realtor outreach and broker events
This is the channel builders underinvest in most consistently, and it’s the one I push hardest. In metro Atlanta, roughly 62% of new construction buyers are represented by a realtor. Winning realtor referrals means winning a majority of the potential buyer pool.
Realtor outreach includes maintaining a database of active agents in the submarket, sending monthly inventory and incentive updates, hosting quarterly broker events at the model home (lunch-and-learn format works, cocktail events work better), and ensuring the co-op commission is competitive with resale listings in the area.
The cost per registration from realtor-referred traffic is difficult to isolate because the investment is relational, not transactional. But the conversion rate tells the story. Realtor-referred visitors convert to contracts at 14% to 19%, the highest of any channel. The realtor has already pre-qualified the buyer, explained the community, and set expectations. By the time they walk into the model home, they’re evaluating, not exploring.
A well-run broker event costs $1,500 to $3,000 (food, beverages, printed materials, maybe a raffle incentive for attending agents). If it produces five realtor referrals over the following 60 days, and one of those converts to a contract on a $475,000 home, the ROI is self-evident.
Community signage and wayfinding
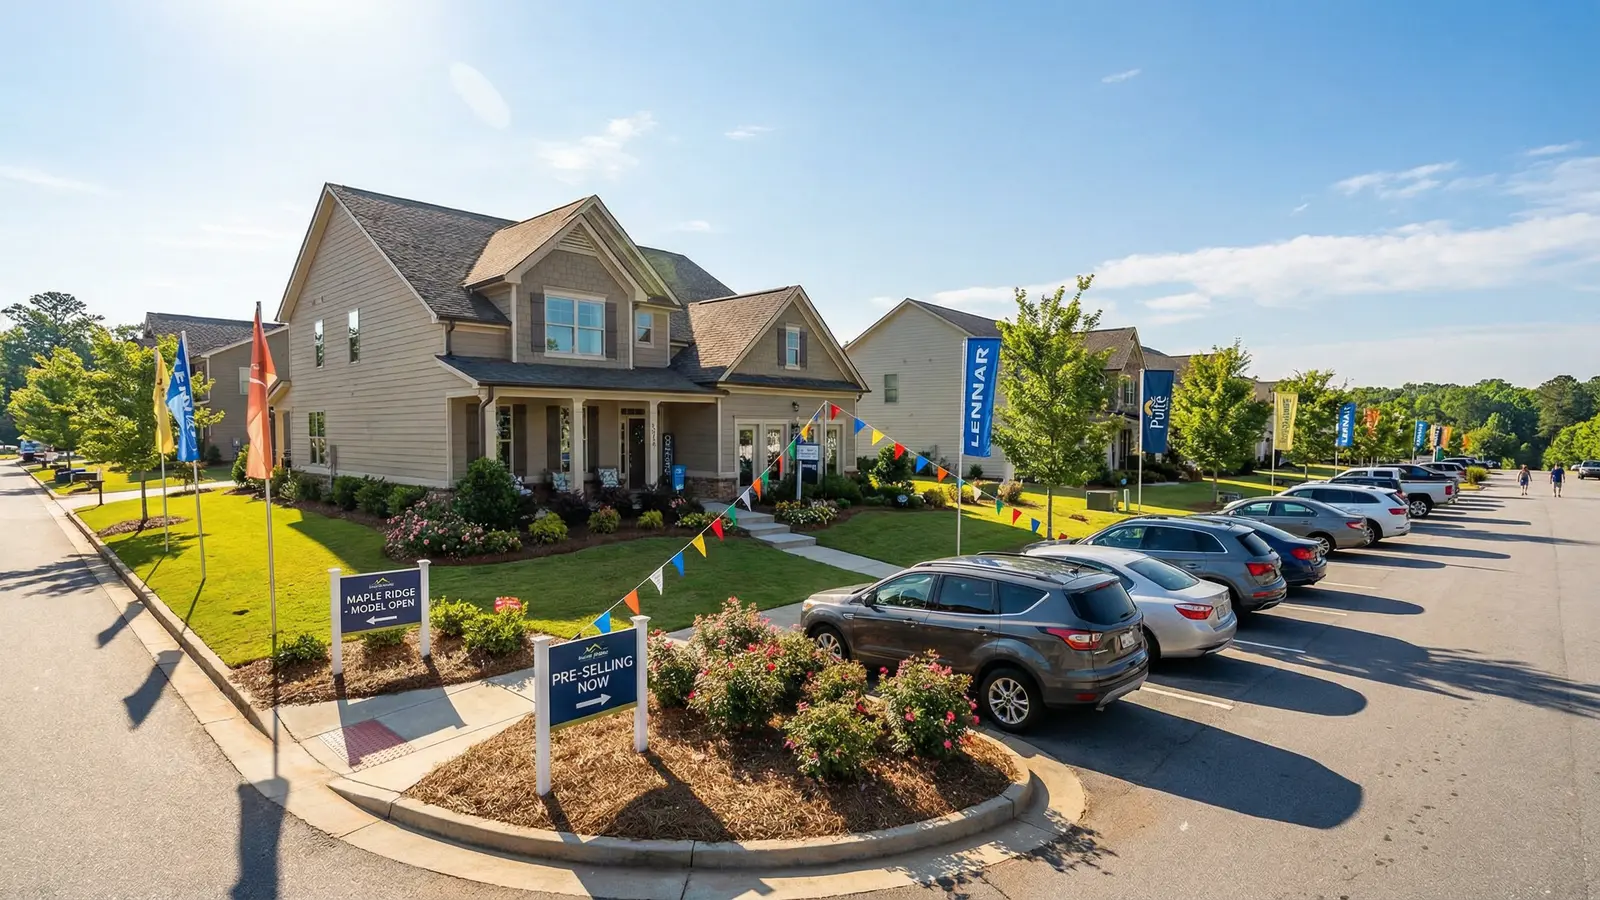
Directional signs, community monument signs, and model home banners drive traffic from people who are already in the area. This channel is inexpensive ($3,000 to $8,000 for initial signage, minimal ongoing cost) and produces a steady baseline of 10% to 15% of total registrations.
The traffic quality from signage is unpredictable. Some visitors are serious buyers exploring the neighborhood. Some are neighbors curious about what’s being built. Registration-to-contract conversion from signage-sourced traffic runs 7% to 10%.
Where signage matters most is in the first 90 days of a community. Before the MLS listings populate and the digital campaigns build momentum, signage is often the primary traffic driver. Getting directional signs placed on the three or four highest-traffic roads within a two-mile radius of the community is one of the first items on my community launch checklist.
Events (grand openings, open houses, seasonal promotions)
Grand opening events and seasonal open houses produce traffic spikes. A well-executed grand opening can generate 40 to 80 registrations in a single weekend. The cost runs $5,000 to $15,000 depending on scale (catering, entertainment, advertising the event, temporary staffing for traffic management).
The challenge with events is converting that traffic spike into contracts. Event visitors include serious buyers, casual shoppers, neighbors, and people who came for the food. Registration-to-contract conversion from events typically runs 4% to 7%. The value of events is pipeline building, not same-day sales. The follow-up system after the event determines whether those 60 registrations become six contracts or zero.
Print and direct mail
I include this for completeness, but the numbers are clear. Print advertising and direct mail produce registrations at $280 to $450 each in the Atlanta market. Conversion rates are comparable to signage (7% to 10%). The cost-per-contract math makes print the least efficient channel for most communities.
There are exceptions. Luxury communities ($800K+) with a defined geographic target audience can use direct mail effectively because the buyer pool is small and the margin per unit justifies the higher acquisition cost. For communities under $600K, print spend almost always performs worse than reallocating those dollars to Google search or realtor events.
How to measure what’s working
The measurement system requires three things: consistent source tracking at registration, a CRM that connects registrations to contracts, and monthly channel ROI calculations.

Source tracking means asking every visitor how they found the community and recording it in the registration system. Not “internet” as a catch-all. The specific portal, the specific ad, the specific realtor. This is a training issue. The onsite agent needs a defined source list and the discipline to capture it accurately every time.
The CRM connection is what most builders lack. Tracking registrations by source tells you which channels drive traffic. Tracking contracts by source tells you which channels drive revenue. Those are different questions with different answers. A channel producing 30 registrations per month at $40 each looks efficient until you discover that only one of those registrations converted, making the cost per contract $1,200. A channel producing eight registrations per month at $110 each looks expensive until three of those convert, making the cost per contract $293.
Monthly ROI calculations divide total marketing spend by channel by contracts produced by channel. The result is cost-per-contract by channel, which is the only metric that connects marketing spend to revenue.
What Velocity tracks and optimizes
Every community I manage gets a marketing channel ROI analysis in the monthly report. The analysis includes cost-per-registration and cost-per-contract by channel, month-over-month trend lines for each channel, recommendations for reallocation based on the data, and projected impact of proposed changes.
When a channel underperforms for two consecutive months, I recommend reducing spend and reallocating. When a channel outperforms, I recommend testing increased investment. The adjustments are incremental ($500 to $2,000 shifts per month), not dramatic, because marketing channels need time to stabilize after changes.
One of the communities I took over in Forsyth County last year was spending $6,200 per month on Google display ads that had produced zero contracts in the previous quarter. Forty-one registrations, zero contracts. The display campaign was generating awareness but not intent. I shifted $4,000 of that budget to a realtor outreach program (monthly email updates to 340 agents, one broker lunch event, and a $500 co-op bonus for the first five referrals). Within 90 days, realtor referrals had produced four contracts. The remaining $2,200 stayed in Google search ads, which continued performing at a $780 cost-per-contract rate.
Download: builder marketing channel ROI tracker {#downloadable}
The Builder Marketing Channel ROI Tracker is a spreadsheet-based tool that lets you input your monthly spend by channel, track registrations and contracts by source, and calculate cost-per-registration and cost-per-contract automatically. It includes benchmark data from Velocity’s managed communities so you can compare your channel performance against market averages.
Enter your name and email to download the tracker.
[Download the Builder Marketing Channel ROI Tracker]
Where this connects
Marketing ROI analysis is one component of the broader onsite sales management for builders system. The marketing data feeds into pricing recommendations, incentive strategy, and quarterly strategic reviews. If your community is in the launch phase, the community launch playbook covers how to sequence marketing spend during the critical first 90 days. For a builder consultation on marketing optimization for your specific community, schedule a consultation.
—
Written by Itanza Johnson, Managing Broker at Velocity Real Estate. Georgia Tech industrial engineering graduate. Former Division Sales Manager at John Wieland Homes and VP of Sales and Marketing at Stonecrest Homes. $600M+ in cumulative residential sales across metro Atlanta.
Thinking about buying or selling in metro Atlanta?
Velocity Real Estate has closed more than $600M in new construction and resale across 19 metro Atlanta neighborhoods. Start with a conversation, not a commitment.
Book a consultationCall 678-278-9798