Silver tsunami and Atlanta real estate impact

Silver tsunami and Atlanta real estate impact
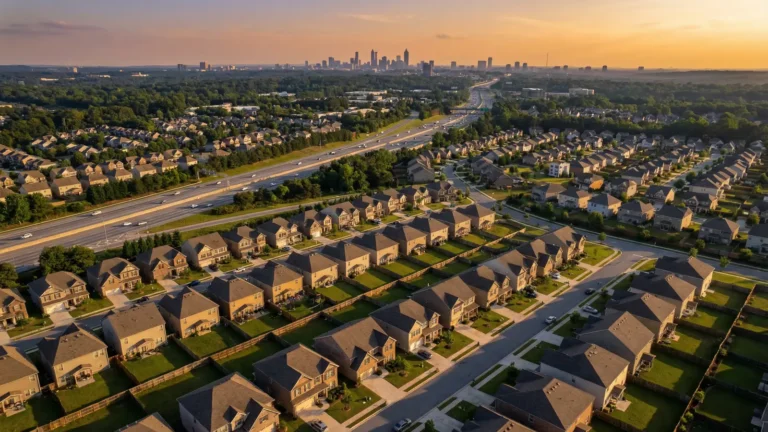
The silver tsunami is a phrase that gets thrown around in national housing commentary, but the Atlanta-specific version of this story looks different from the national narrative. Baby boomers own approximately 38% of owner-occupied housing in the 11-county metro Atlanta region, according to American Community Survey data. That is roughly 640,000 homes. The question real estate analysts have been asking for a decade is when those homes hit the market. In 2026, we are starting to see the early answer.
I track listing activity by seller age cohort (using public records and MLS agent remarks) across our coverage area. In Q3 and Q4 of 2025, listings from homeowners aged 65 and older increased 19% year-over-year in north metro Atlanta. That is not a wave. It is the first visible ripple. Understanding where and when the wave builds matters for every buyer, seller, and builder operating in this market.
Who holds the inventory: boomer homeownership by neighborhood
Not every Atlanta neighborhood will experience the silver tsunami equally. The impact depends on what percentage of homeowners in a given area are 65 or older, how long they have owned their homes, and what their properties are worth.
The neighborhoods with the highest concentration of 65+ homeowners in metro Atlanta cluster in a pattern that reflects the suburban development waves of the 1970s, 1980s, and early 1990s.
| Area | Est. % homeowners 65+ | Median year built | Median home value | Est. homes held by 65+ |
|---|---|---|---|---|
| East Cobb (30062/30066) | 34% | 1985 | $485,000 | 11,200 |
| Dunwoody (30338/30346) | 31% | 1982 | $520,000 | 8,400 |
| North Buckhead | 29% | 1978 | $680,000 | 4,100 |
| Roswell (30075/30076) | 27% | 1988 | $545,000 | 9,800 |
| Peachtree Corners | 26% | 1986 | $440,000 | 5,600 |
| Sandy Springs (30328) | 25% | 1983 | $590,000 | 6,200 |
| Johns Creek (30097) | 22% | 1994 | $575,000 | 7,300 |
| Alpharetta (30009) | 19% | 1998 | $610,000 | 5,100 |
Sources: U.S. Census Bureau American Community Survey (5-year estimates), Fulton/Gwinnett/Cobb County tax assessor records.
The pattern is intuitive. Neighborhoods that were built out in the 1970s and 1980s have the highest boomer concentrations. East Cobb, Dunwoody, and North Buckhead were the prestige suburban addresses of that era. The families who bought there in their 30s and 40s are now in their 70s and 80s.
By contrast, newer suburbs like Alpharetta (which developed heavily in the late 1990s and 2000s) and Johns Creek (incorporated in 2006) have lower boomer concentrations. The boomers in those communities tend to be “younger old” (65 to 72), and they are further from the life transitions that trigger a sale.
The timeline: when does this inventory arrive?
The silver tsunami is not a single event. It is a 15-to-20-year process that unfolds through five triggering events: death of a spouse, a move to assisted living or a retirement community, a health crisis requiring downsizing, a relocation to be near adult children, and (increasingly) a financial decision to cash out home equity for retirement income.

Based on actuarial tables and the age distribution of 65+ homeowners in metro Atlanta, here is the estimated inventory release timeline.
2026 to 2028: The first wave, driven primarily by homeowners aged 78 and older. Estimated 8,000 to 12,000 homes across the metro region, concentrated in East Cobb, Dunwoody, and the older sections of Roswell and Sandy Springs. These homes are primarily 3-to-4-bedroom ranch and split-level designs on half-acre to one-acre lots. Many will need significant renovation (original kitchens, bathrooms, HVAC systems from the 1980s).
2029 to 2032: The larger wave, as homeowners now aged 70 to 77 begin transitioning. Estimated 18,000 to 25,000 homes. This wave includes higher-value inventory in North Buckhead, Sandy Springs, and Johns Creek. Home conditions will vary widely, from well-maintained to deferred maintenance.
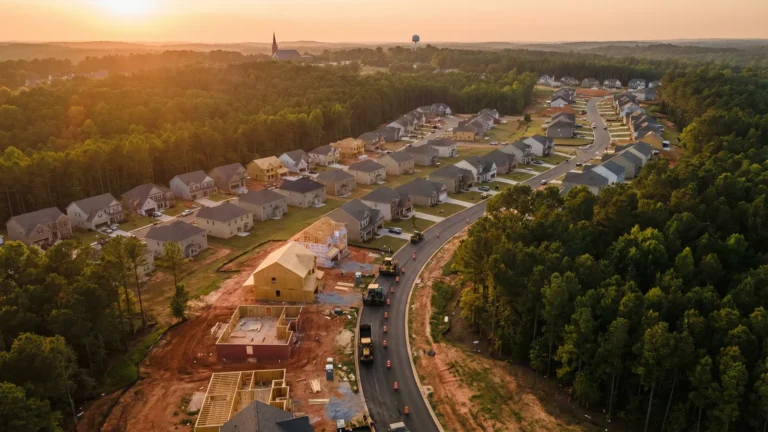
2033 to 2040: The tail wave, as the youngest boomers (born 1960-1964) reach their mid-70s. This cohort owns newer homes in Alpharetta, Johns Creek, and Milton. Their inventory is in better condition and appeals to a broader buyer pool.
The total estimated impact: 45,000 to 55,000 additional homes entering the metro Atlanta resale market over 15 years, beyond normal turnover. That is not the “flood” that clickbait articles predict, but it is a sustained increase in supply that changes the market dynamics in specific neighborhoods.
Pricing impact: what happens to home values in boomer-heavy neighborhoods
Here is where I diverge from the analysts who predict price drops. The pricing impact depends on two factors that vary by neighborhood: the condition of the homes and the desirability of the location.
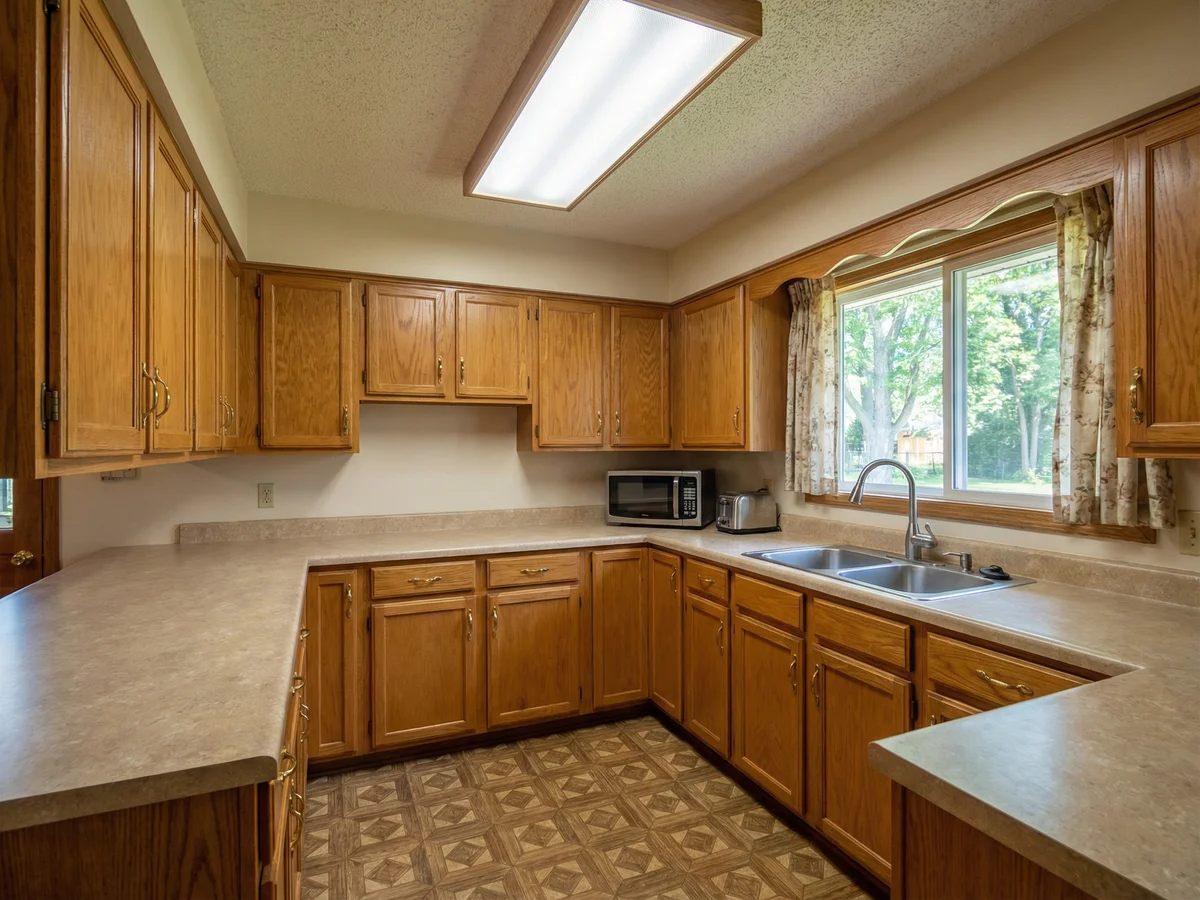
In East Cobb, where 11,200 homes are held by 65+ owners and the median year built is 1985, many of these homes will come to market needing $80,000 to $150,000 in updates. A 1985 kitchen with laminate counters and oak cabinets sits in a 2026 market where buyers expect quartz, soft-close drawers, and an open floor plan. These homes will sell, but they will sell at a discount to renovated comparables. That discount creates opportunity for buyers willing to take on a renovation project, and it creates competition for sellers of already-renovated homes in the same neighborhoods.
In North Buckhead and Sandy Springs, the location premium absorbs some of the condition discount. A 1978 ranch on a one-acre lot in North Buckhead, even with an outdated interior, sits on land worth $400,000 or more. Builders are already buying these lots for teardown-and-rebuild projects. The silver tsunami in premium locations accelerates the teardown cycle, which actually supports or increases land values even as structure values decline.
In Johns Creek and Alpharetta, where boomer-held homes were built in the 1990s and 2000s, the condition gap is smaller. These homes need cosmetic updates, not structural renovation. They will compete directly with new construction in the same submarkets, and that competition is the pricing pressure point. When a buyer can choose between a 2001-built resale at $575,000 and a 2026 new construction at $625,000, the decision comes down to lot size, location within the community, and how much they want to deal with an HOA transfer process.
For the broader price forecast for 2026, the silver tsunami adds supply without collapsing prices. The increase is gradual, geographically specific, and absorbed by a market that remains undersupplied at the macro level.
What this means for buyers: the opportunity window
The buyer opportunity is real, but it requires a specific approach.
Move-up buyers looking for larger homes or better lots should target East Cobb, Dunwoody, and Roswell, where lot sizes (half-acre to one-acre) are larger than anything available in new construction communities. The homes will need work. Budget $100,000 to $150,000 for a full kitchen, bathroom, and systems renovation on top of the purchase price. The total investment (purchase plus renovation) will often still come in below the cost of comparable square footage and lot size in a new construction community.
I walked a property in East Cobb last fall with a move-up buyer from Suwanee. The home was a 1987 build, 4,200 square feet on 0.8 acres. Original everything. The sellers (a couple in their early 80s, moving to a retirement community in South Carolina) listed at $510,000. After a $130,000 renovation budget, my buyer would be all-in at $640,000 for a home that would appraise at $720,000 to $750,000 based on renovated comparables in the same subdivision. She closed in November.
First-time buyers should watch the townhome and smaller single-family inventory that boomers are vacating. In Peachtree Corners and Tucker, boomer-owned townhomes from the 1980s and 1990s are entering the market at $275,000 to $350,000. These are not glamorous properties, but they are entry points in locations with strong commute access.
Investors focused on renovation-and-hold or renovation-and-flip should focus on the ZIP codes with the highest boomer concentrations and the strongest school districts. East Cobb (30062), Dunwoody (30338), and Roswell (30075) check both boxes. The spread between as-is purchase price and after-renovation value in these ZIPs is running $100,000 to $180,000 on properties that need full interior renovation. For how this connects to the fastest growing suburbs, the growth suburbs represent new inventory supply while the boomer suburbs represent resale inventory supply. Both dynamics are operating simultaneously.
The seller side: what boomers need to know
If you are a homeowner over 65 considering a sale in the next three to five years, the timing question is straightforward. Sell before your neighbors do. In neighborhoods with high boomer concentration, the first homes to market in good condition will capture the strongest prices. As more similar inventory arrives over the following years, competition increases and pricing leverage decreases.
I advise boomer sellers to get a pre-listing inspection and a renovation cost estimate 12 to 18 months before they plan to sell. Not because they need to renovate everything, but because knowing the cost of a kitchen update or a new HVAC system allows them to price accurately and negotiate from a position of knowledge. The worst outcome is a buyer’s inspection revealing $40,000 in deferred maintenance that the seller did not account for.
For a deeper look at how to compare these suburban markets, see the suburbs comparison guide and the metro Atlanta real estate market report.
Download the silver tsunami impact assessment guide
The Silver Tsunami Impact Assessment Guide maps the boomer homeownership data by ZIP code across 20 metro Atlanta neighborhoods. It includes estimated inventory release timelines, renovation cost ranges by home era (1970s, 1980s, 1990s), a buyer opportunity scorecard for identifying high-potential neighborhoods, and a seller timing worksheet for homeowners planning a sale in the next one to five years.
Four pages. Data-driven. Built for buyers looking for opportunity and sellers planning their exit.
Enter your name and email to download.
[Download: Silver Tsunami Impact Assessment Guide]
—
Written by Itanza Johnson, Managing Broker at Velocity Real Estate. Georgia Tech industrial engineering graduate. Former Division Sales Manager at John Wieland Homes and VP of Sales and Marketing at Stonecrest Homes. $600M+ in cumulative residential sales across metro Atlanta.
Thinking about buying or selling in metro Atlanta?
Velocity Real Estate has closed more than $600M in new construction and resale across 19 metro Atlanta neighborhoods. Start with a conversation, not a commitment.
Book a consultationCall 678-278-9798